Layouts and Reports
Layouts
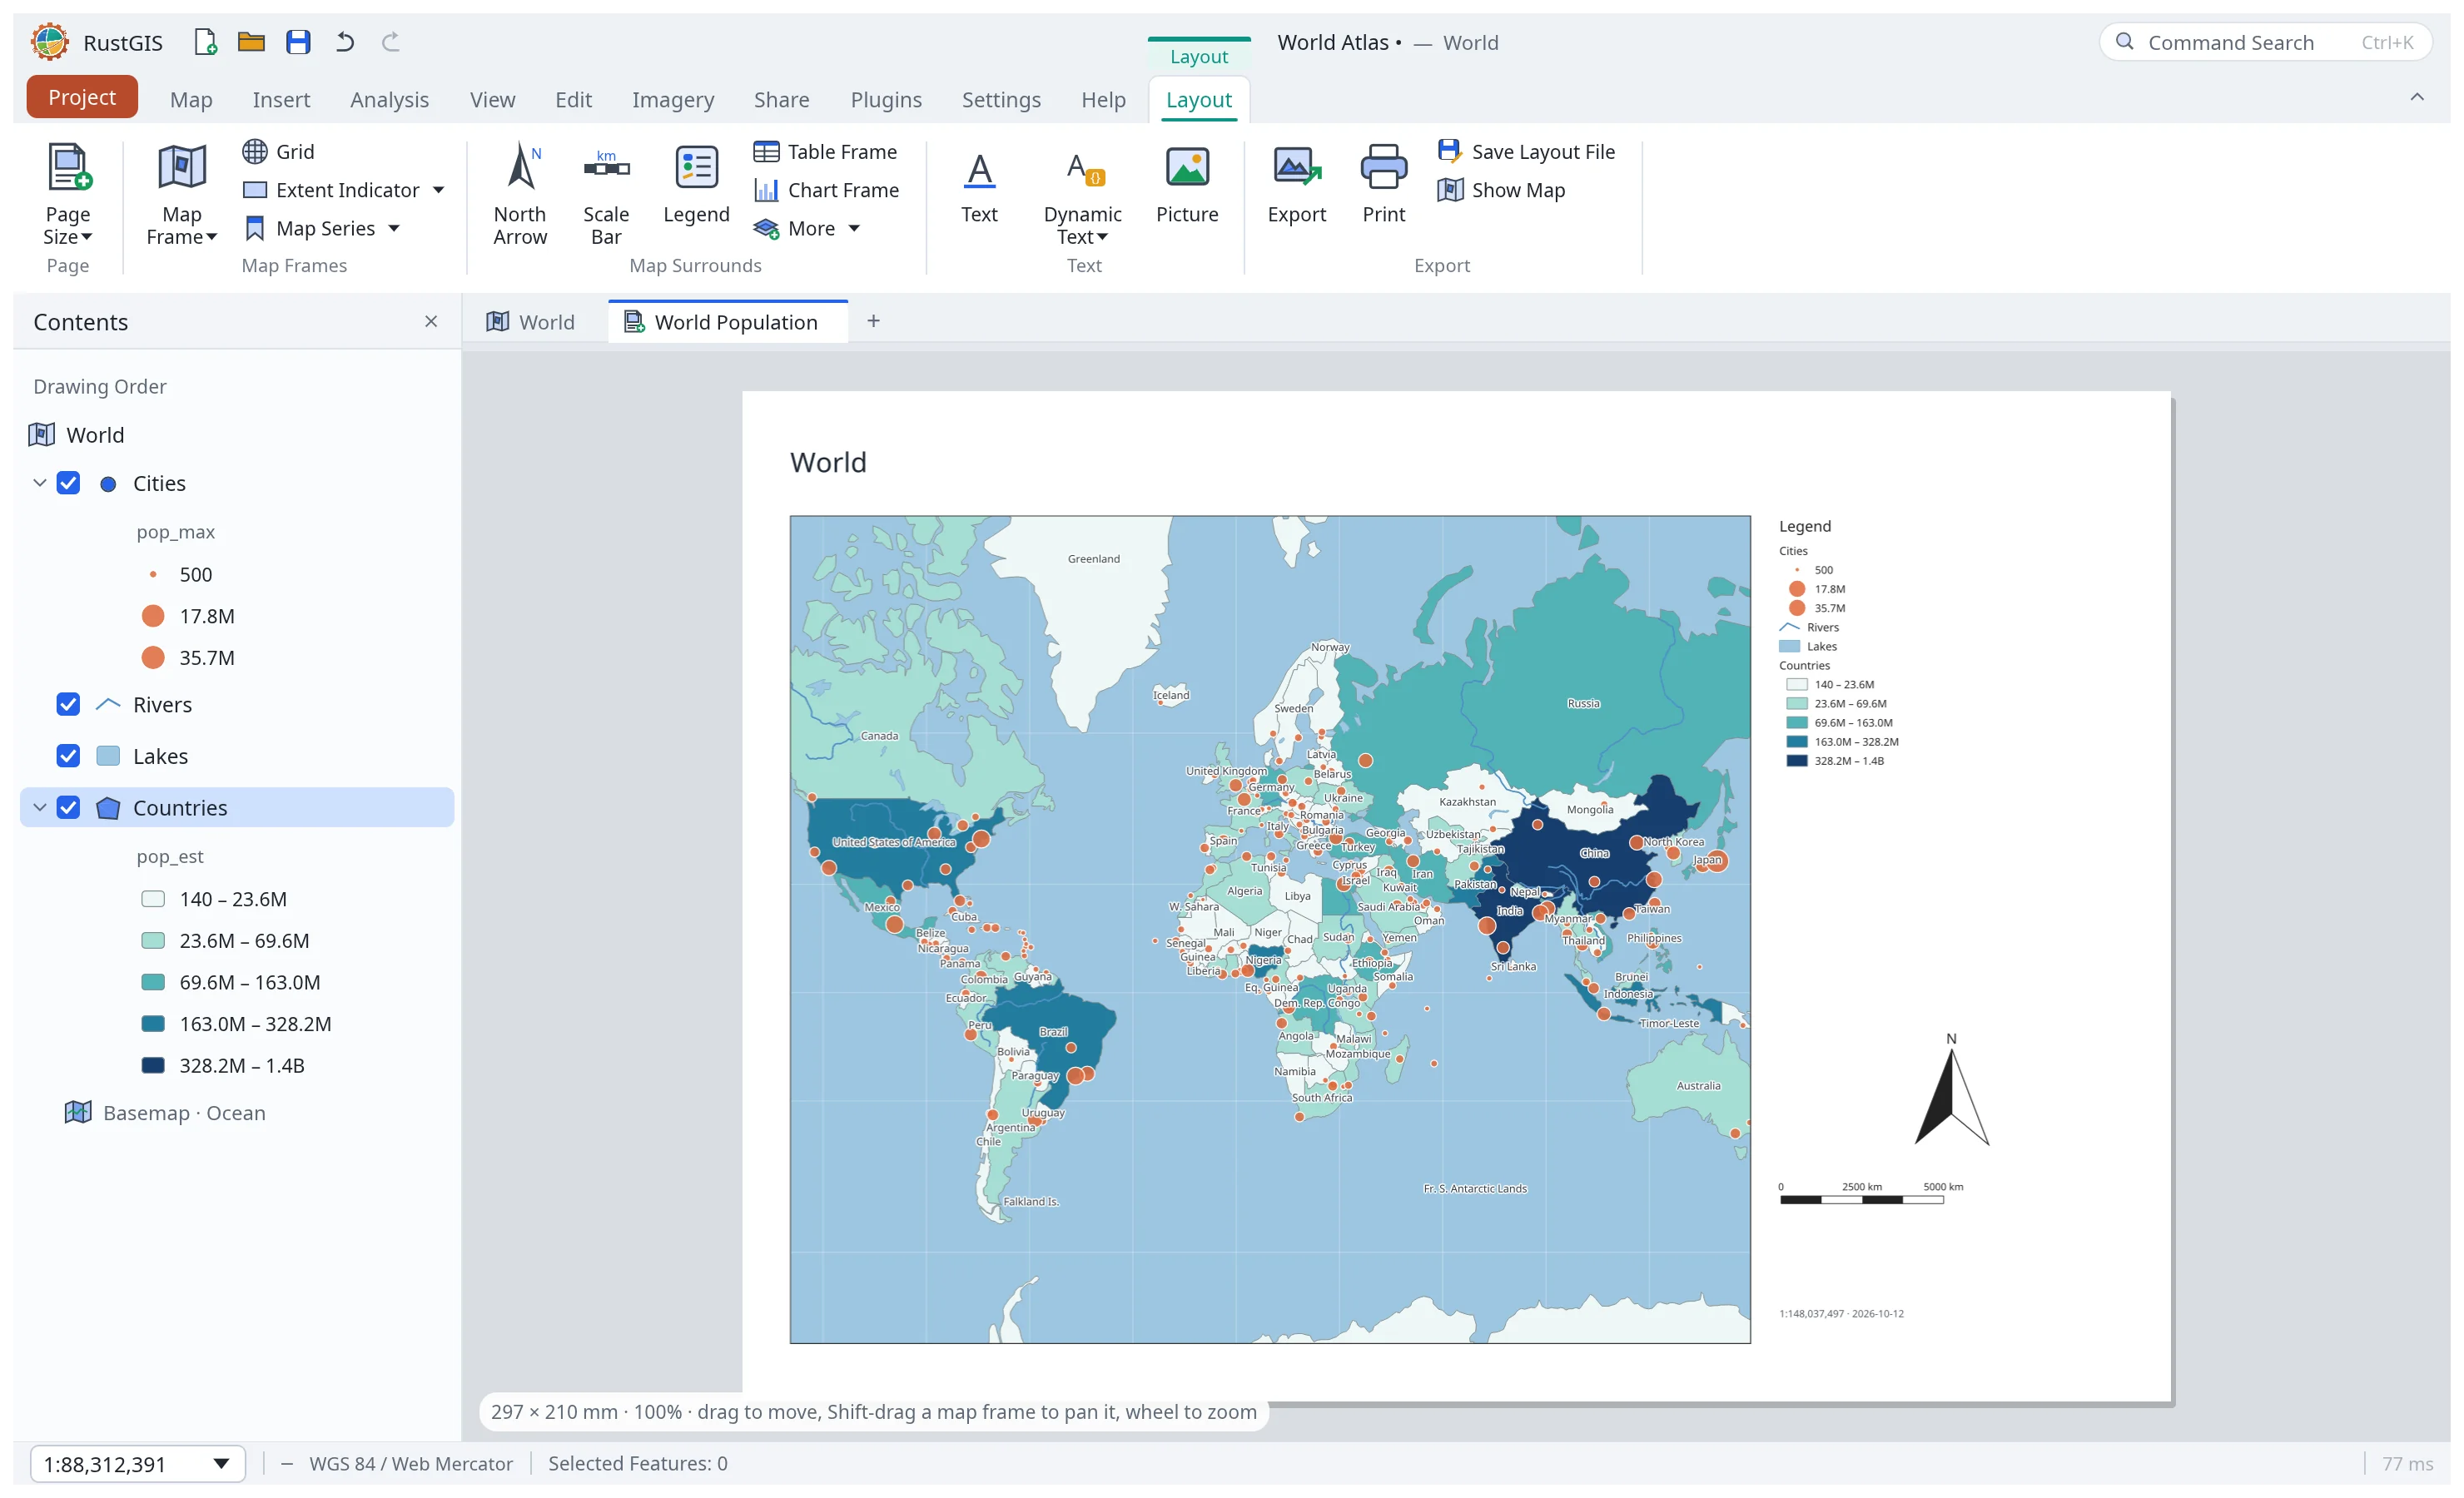
Insert › New Layout adds a page layout (Letter to A0, landscape or portrait) with a map frame, title, legend, north arrow, scale bar and a dynamic credits line. Layouts open as tabs next to the maps, with a Layout tab on the ribbon:
- Map frames: rectangle, circle and ellipse frames, or polygon and lasso frames drawn on the page. Each frame shows a map of the project at its own centre and scale; Shift-drag a frame to pan its map, double-click it to match the map view, or set the scale in its properties. Grid draws a labelled graticule over a frame; Extent Indicator outlines another frame's extent (an overview map).
- Map surrounds: north arrow, scale bar, legend, table frame (a layer's attribute table) and chart frame (a bar chart of a numeric field), plus a neatline or backdrop.
- Text and Dynamic Text:
{date},{time},{scale},{map},{crs},{page},{pages},{pageName}and{layout}fill in when the page is drawn. Picture places a PNG or JPEG. - Map Series: one page per feature of an index layer, with the frame zoomed to each feature; step through pages, refresh, and export every page into one PDF.
- Click an element to select it, drag to move, drag its handles to resize, and edit it in the properties panel. The wheel zooms the page.
- Export writes PDF (every map series page) or PNG; Print opens the PDF in the system
viewer; Save Layout File and Import Layout move layouts between projects
(
.rgislayout).
Reports
Insert › New Report lists the selected layer's records page after page; the Report pane previews it and sets it up.
- Data: pick the detail Fields (or Autofill Fields), Group records by up to four
fields (each group gets a heading and its own statistics), add Statistics (count, sum,
mean, minimum, maximum), a Dynamic Picture per record (a field holding a PNG/JPEG path relative to the saved
project's folder, or base64 image data), Attachments (a field listing each record's files,
separated by
;; image files show when they're inside the project's folder), and a Chart Frame (records, or a field's sum, per category). - Report Section: Supplemental Pages of text before or after the records, New Template and Existing Template (a page layout drawn as a report page), a Related Report appended after this one, and Subreports (each record's related records through a relationship, listed beneath it).
- A where clause or the layer's selection limits the records; a sort field orders them within their groups.
- Share › Report: Export Report writes a PDF (or the first page as PNG); Save As Report File keeps the report, and Report Template its design without the data source, to start reports on other layers (Insert › Import Report).
Presentations and notebooks
Insert › New Presentation starts a presentation with a title page; the Presentation pane previews, edits and plays it.
- Page: a Map page shows the map view as it is now, a Blank page shows text on a coloured page, an Image page a picture with a caption, and a Video page a video file or URL with an optional poster picture.
- Each page has a title, speaker notes and a duration (for Play), and can move up or down.
- Share › Presentation › Export Presentation writes a self-contained HTML slideshow (arrow
keys,
Nfor notes,Pto play; videos play in place), a PDF, or the first page as PNG. Save As Presentation File keeps it to import into other projects.
Insert › New Notebook starts a notebook of text and command cells; Add and Open opens a
RustGIS (.rgisnb) or Jupyter (.ipynb) notebook. A command cell runs one command per line
(id {json}, as in scripts) and shows each command's result beneath it. Notebooks save in
either format.