Cartography
Symbology
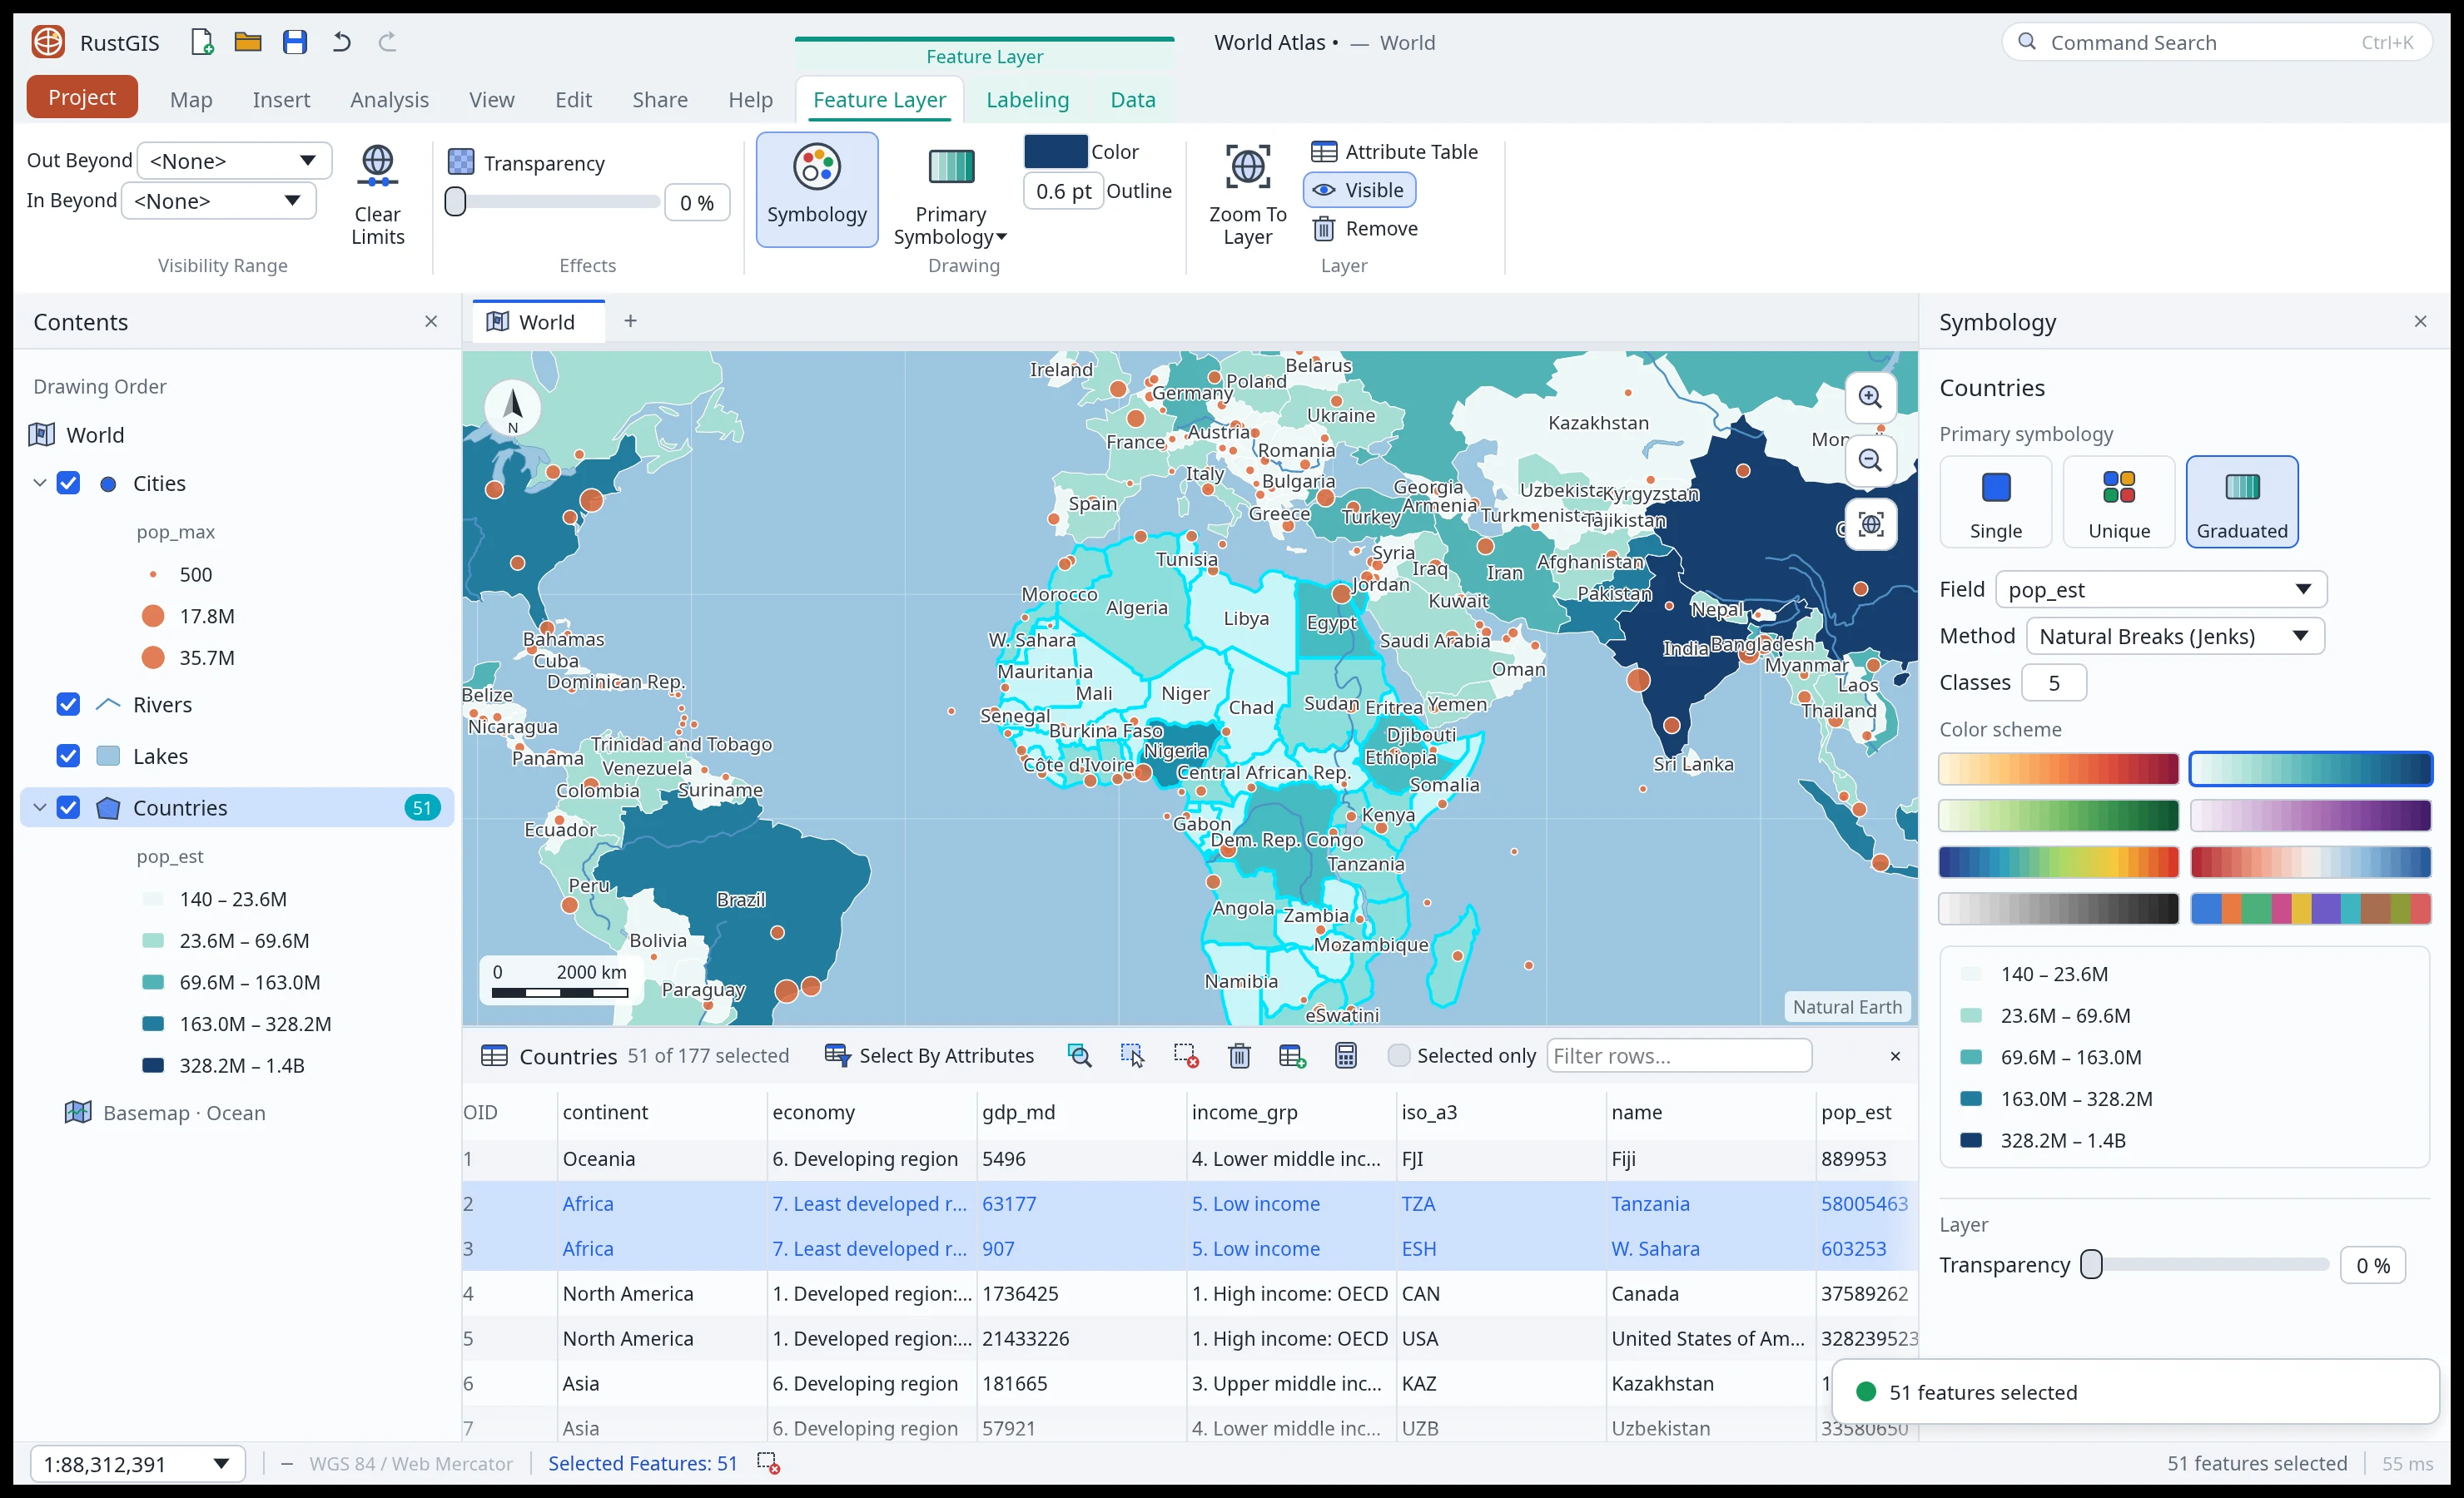
Select a layer in Contents and open Feature Layer › Symbology (or the Symbology pane):
- Single Symbol: one fill, outline and marker for every feature.
- Unique Values: one colour per distinct value of a field.
- Graduated Colors: 1 to 12 classes of a numeric field by natural breaks (Jenks), equal interval or quantile.
- Proportional Symbols: point size grows with a numeric field.
Pick a colour scheme from the pane's swatches. The Feature Layer tab sets the fill Color, the Outline width, Transparency and a Visibility Range (the scales between which the layer draws); points can be circles, squares, triangles, diamonds or stars. Data › Definition Query draws only the features matching a SQL clause, and a layer with subtypes can be symbolized by them. Insert › Styles saves symbology as styles to reuse on other layers and in other projects.
Labeling
Turn labels on per layer (Map › Labeling › Label, or the Labeling tab), then:
- Visibility Range: draw labels only between two scales (Out Beyond / In Beyond), or between two viewing distances (Closest / Farthest). Clear Limits removes all four.
- Placement: automatic (above points, centred on lines and polygons), centred, or one of eight positions around the feature.
- Lock keeps the labelled features fixed while you pan and zoom; Pause stops drawing labels for faster navigation; View Unplaced draws the labels that didn't fit in red.
- Convert turns a layer's labels into an annotation layer: one point per label, carrying its
text in a
TEXTfield, which you can then edit, move or delete like any other features.
Layer effects
These draw on top of the symbology. On the Feature Layer tab: Masking shows a layer only inside another layer's polygons; Display Filters show different features at different scales (a SQL condition per scale range); Aggregation draws points as hexagon or square bins coloured by count; Extrusion raises polygons by a height or a numeric field in an oblique 2.5D view, with Face Culling, Lighting (walls shaded by the way they face the light) and Cast Shadow. On the Raster Layer tab: Layer Blend (multiply, screen, overlay, darken, lighten, difference), Swipe (the layer shows only left of a divider you slide, to compare it with what's beneath), Masking and Rotation.
Graphics
Insert › Graphics draws shapes in a graphics layer (Map › Add Data › Graphics Layer, or one is
made with the first graphic). Point, Line, Curve and Polygon are clicked vertex by vertex
(double-click to finish); Freehand, Lasso, Rectangle, Circle and Ellipse are dragged. Text places
a label where you click, and Dynamic Text adds tokens that update as the map changes: {map},
{scale}, {date}, {time}, {crs}, {layers} and {center}. Picture: drag a rectangle,
then pick a PNG or JPEG image to stretch over it. Tools return to Explore after each graphic
unless Keep Tool is on. Each graphic keeps its own fill, outline, width and text size in the
layer's attributes, so you can edit them in the attribute table or with graphics.style.